Lighthouse CI Server - The Enhanced Lighthouse Experience
Lighthouse CI, But Better
Overview
Lighthouse CI is a wonderful tool that allows you to generate performance reports for your web pages through CI. Did you know there is a way to make it even more lucrative?
Lighthouse CI has a dashboard that you can use to see your reports in a UI. Not only is it easier to use, but it also provides you with more detailed info. Though it requires some setup, you’ll find the end result is more than worth it.
End Result
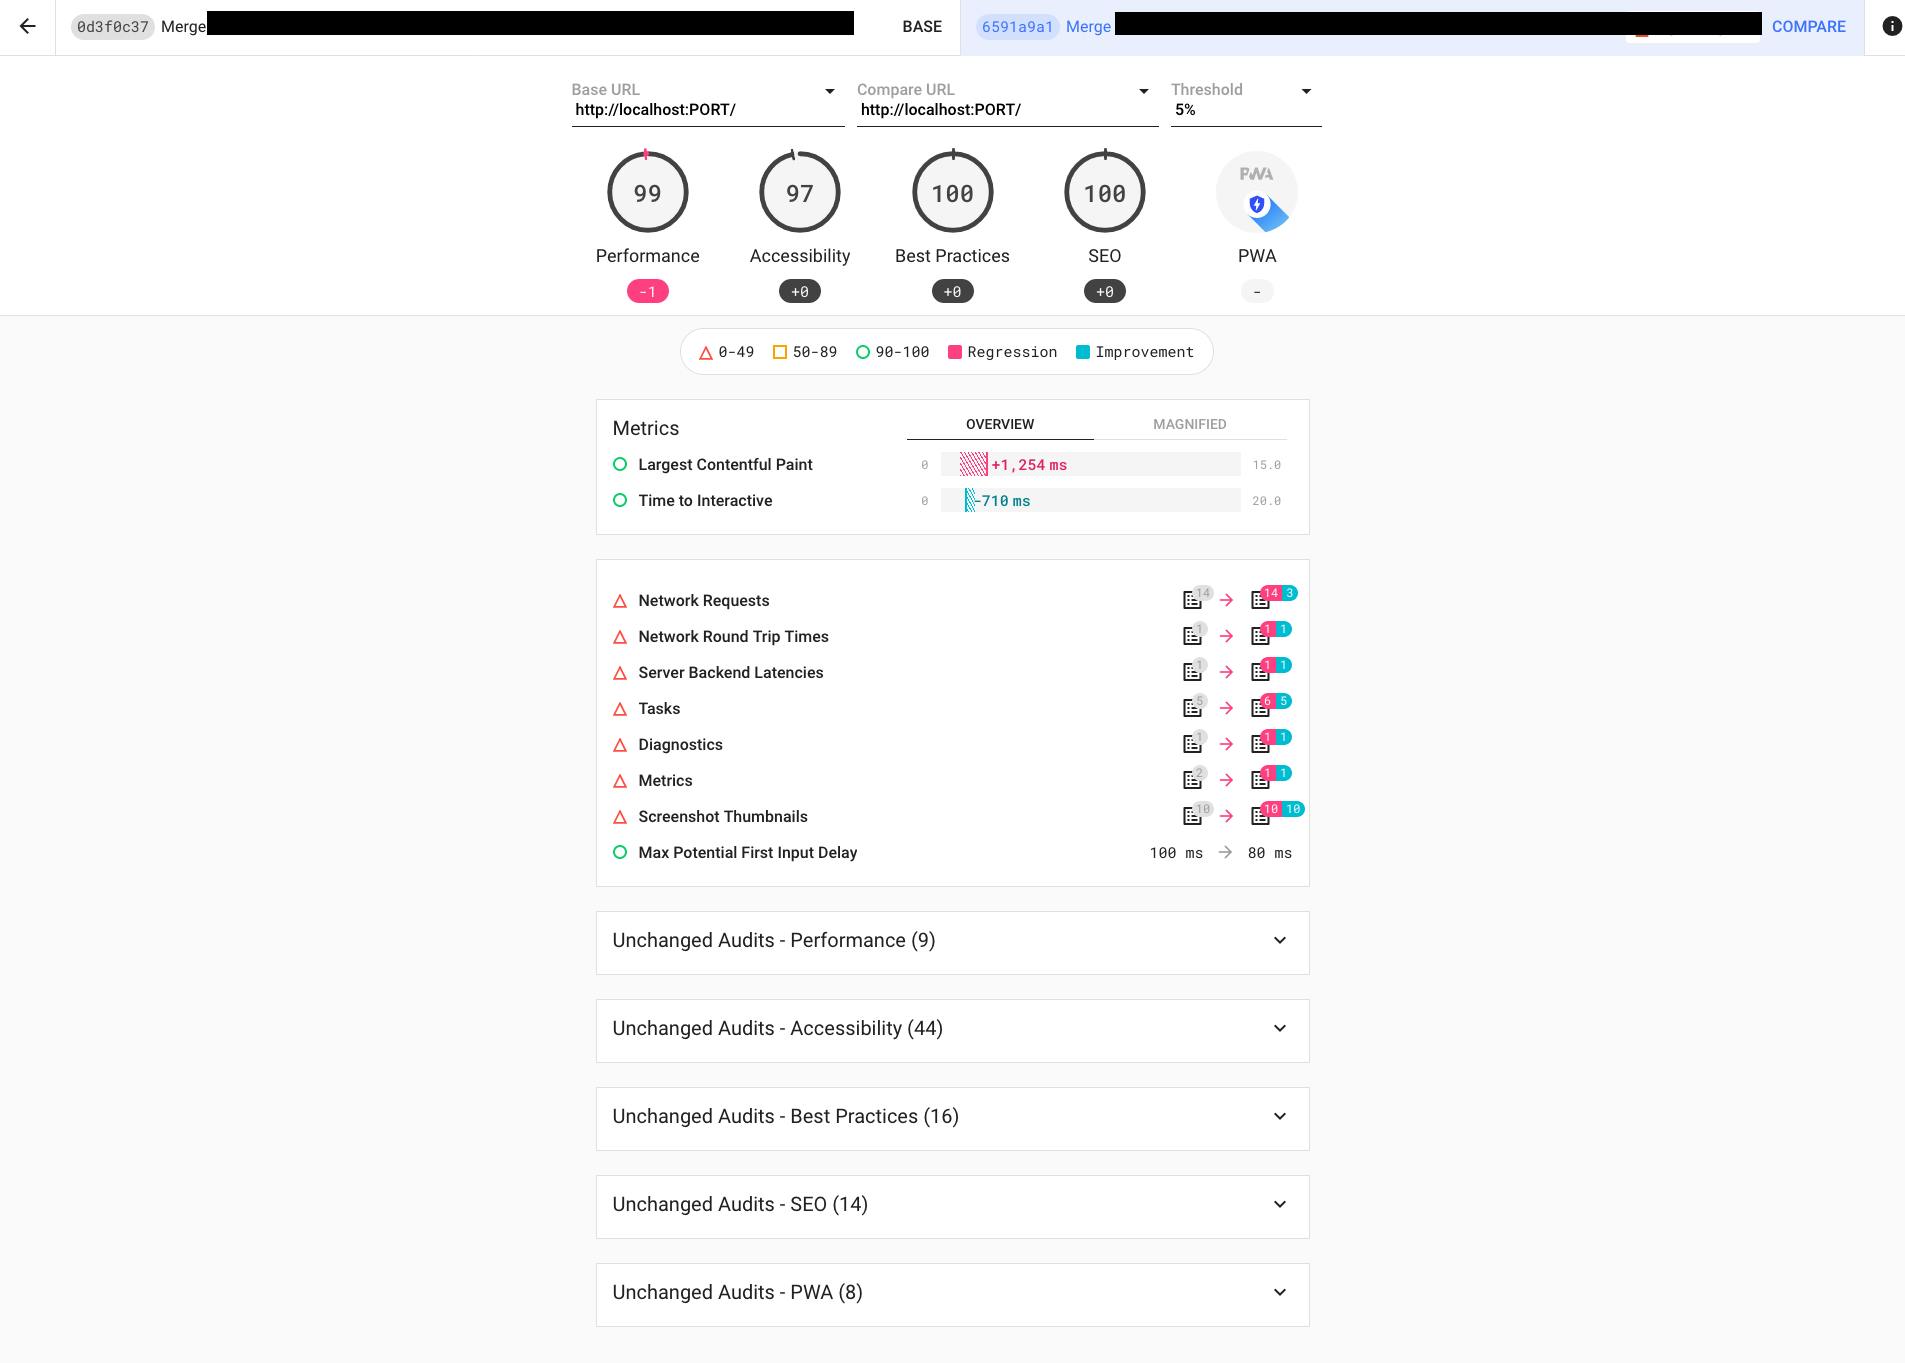
When setup locally, Lighthouse CI will generate a temporary link to your site’s report. Once you follow the steps mentioned in this post, Lighthouse CI will upload your reports to an external server (your server).
Lighthouse CI’s dashboard provides a really clean UI with options that allow you to compare different pages across your various builds. You can see how your pages did in specific tests, so you know where to improve.
Setup
While the dashboard is extremely useful, it does require a fair bit of setup. We’ll go through it together here, so no need to worry. Let’s begin:
- Main Project - this is the project you want to run the tests on
- Server Project - this is the project you will use to run your Lighthouse server
- Heroku App - You need a place to run the server. Google recommends Heroku as it has a free tier you can use to get started quickly.
- Postgres Database - You can set this up on Heroku as well. This is imperative for the dashboard to work.
The Plan
Here are a few steps involved in this setup:
- Configure a Lighthouse Client
- Setup the Lighthouse Server
- Create a Heroku App with Postgres Database
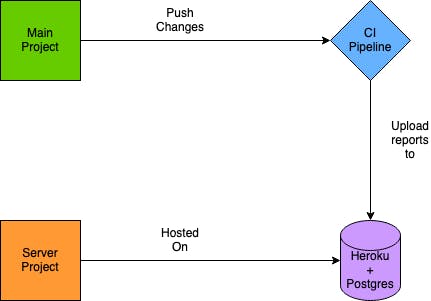
Here’s a depiction of how these pieces fit together:
I’m assuming you already have a Lighthouse CI set up and running locally. If not, you can refer to our Lighthouse CI Beginner's Guide for details.
Configure Lighthouse Client
The Lighthouse Client is your main project. When you run your CI task, instead of generating a temporary link to a report, Lighthouse will now upload the reports to your Dashboard instead. Getting data from your dashboard is easier than getting it from the logs of various CI runs. Here’s how you do it:
module.exports = {
  ci: {
    collect: {
      url: ["Insert Web Page URLs here"], // localhost works too
      startServerCommand: "yarn build && yarn start",
    },
    upload: {
      target: "lhci",
      serverBaseUrl: "[Insert Server URL Here]",
      token: "[Insert Build Token Here]",
    },
    assert: {
      preset: "lighthouse:no-pwa",
    },
  },
};
If you already have a Lighthouse CI setup, then this file should be familiar to you. At the root of your project directory, lighthouserc.js tells Lighthouse how to work. You can configure options here and feed them to Lighthouse.
There are some important things to note here:
- target: We set this as LHCI. This tells Lighthouse to look for an external server instead of generating temporary links.
- serverBaseUrl: This is where you add the URL of your LHCI Server. You will create in a little bit. :)
- token: When you set up LHCI on your server, you’ll get a build token. Paste it here.
Just these three changes are all we need for our Client-side setup. Let’s head on to the Server side.
Setup Lighthouse Server
For the Lighthouse Server, you can create a new project. This project has one goal. It runs the Lighthouse Server. That’s it! Pretty simple.
Start a fresh project and run the following:
curl <https://raw.githubusercontent.com/GoogleChrome/lighthouse-ci/main/docs/recipes/heroku-server/package.json> > package.json
curl <https://raw.githubusercontent.com/GoogleChrome/lighthouse-ci/main/docs/recipes/heroku-server/server.js> > server.js\\
These two files are all you need.
- package.json: This file loads all the necessary dependencies
- server.js: This file fires up the server
Now that we have these two files, we need to run the Lighthouse Wizard.
Install all the dependencies using yarn and run the LHCI wizard. This launches an interactive shell, where Lighthouse asks you how you want to set it up.

Once you’re done, Lighthouse will present you with a Build Token and an Admin Token. Keep them both safe. This Build Token must be pasted in lighthouserc.js under upload.token.
Create Heroku App with Postgres Database
Google recommends Heroku as they provide a free tier. This helps you get started quickly and try out Lighthouse CI yourself. Google provides a small guide here but you’ll give you an idea of what’s involved:
Create an account on Heroku if you don’t have one.
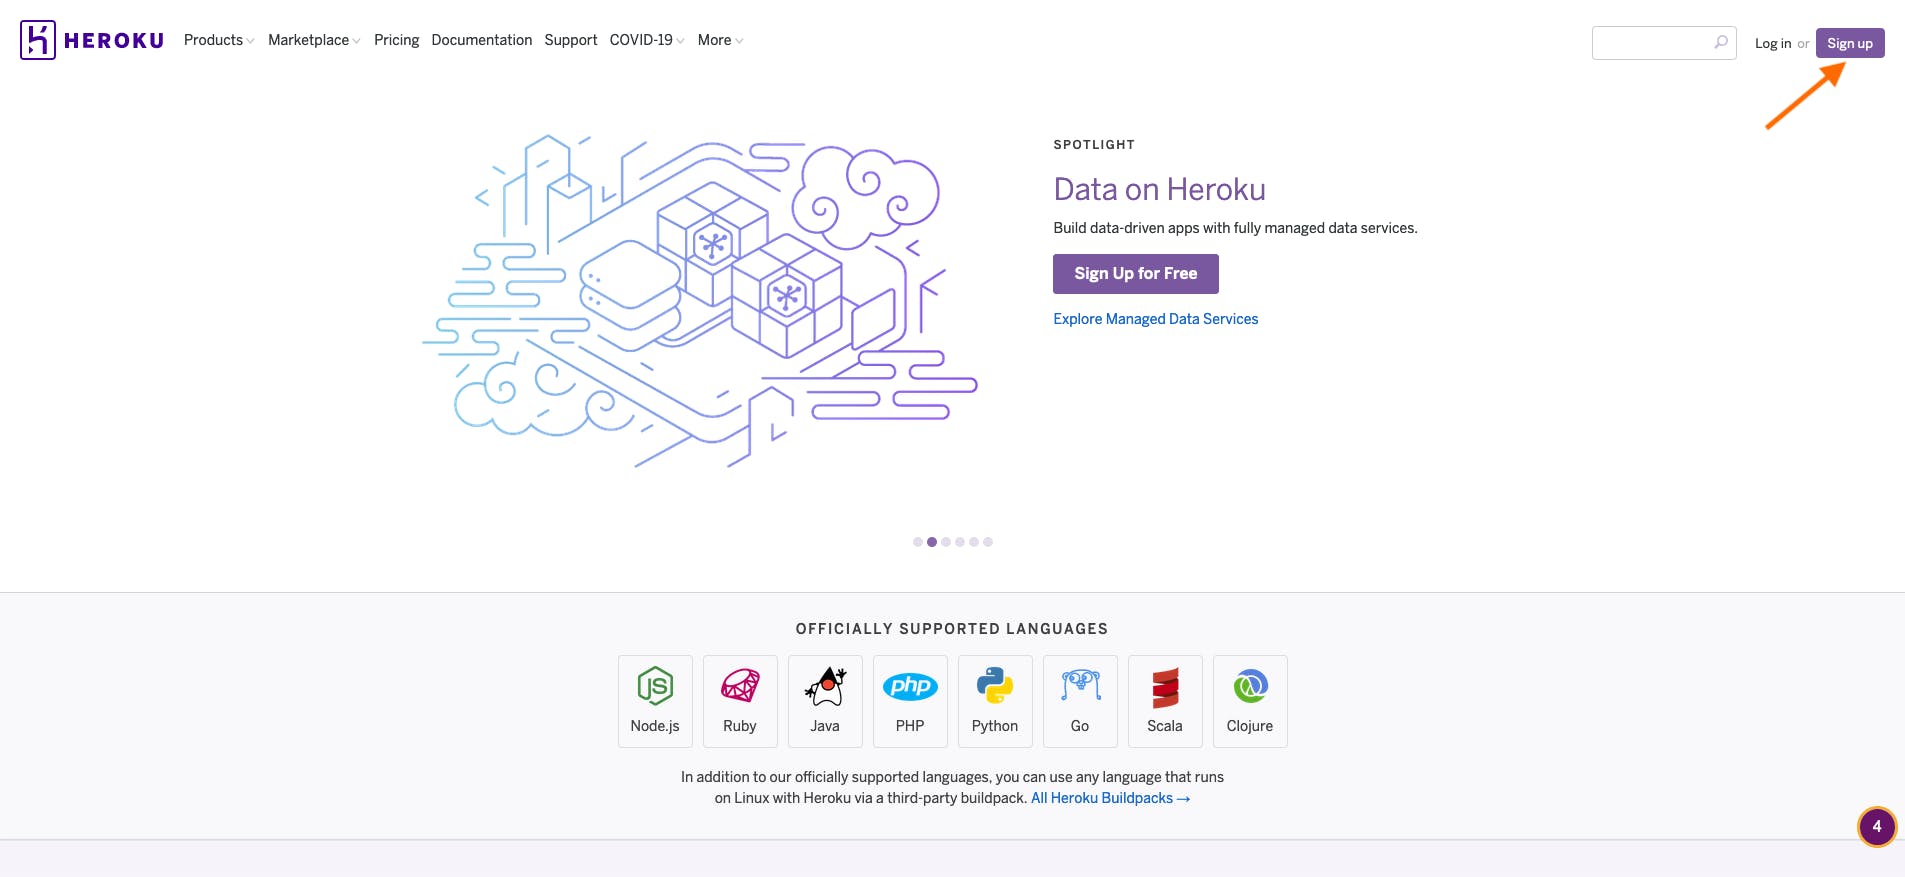
Setup the Heroku CLI. It should be part of the Get Started steps. In case you missed it, you can follow the steps listed here.
Once that’s done, create a project on Heroku. It’s like an instance they provide so you can host your files.

You can add an extension for Postgres using their UI. Go to Overview → Configure Add-ons and search for Postgres. Installing this will set up your Heroku App with a Postgres Database. You don’t need to set it up. Lighthouse will do that.


Finally, push your code to Heroku using
git push heroku main. This will push your code to a repo on Heroku, which gets hosted on the App. You may have to add your app to this command by using the -a app_name flag.
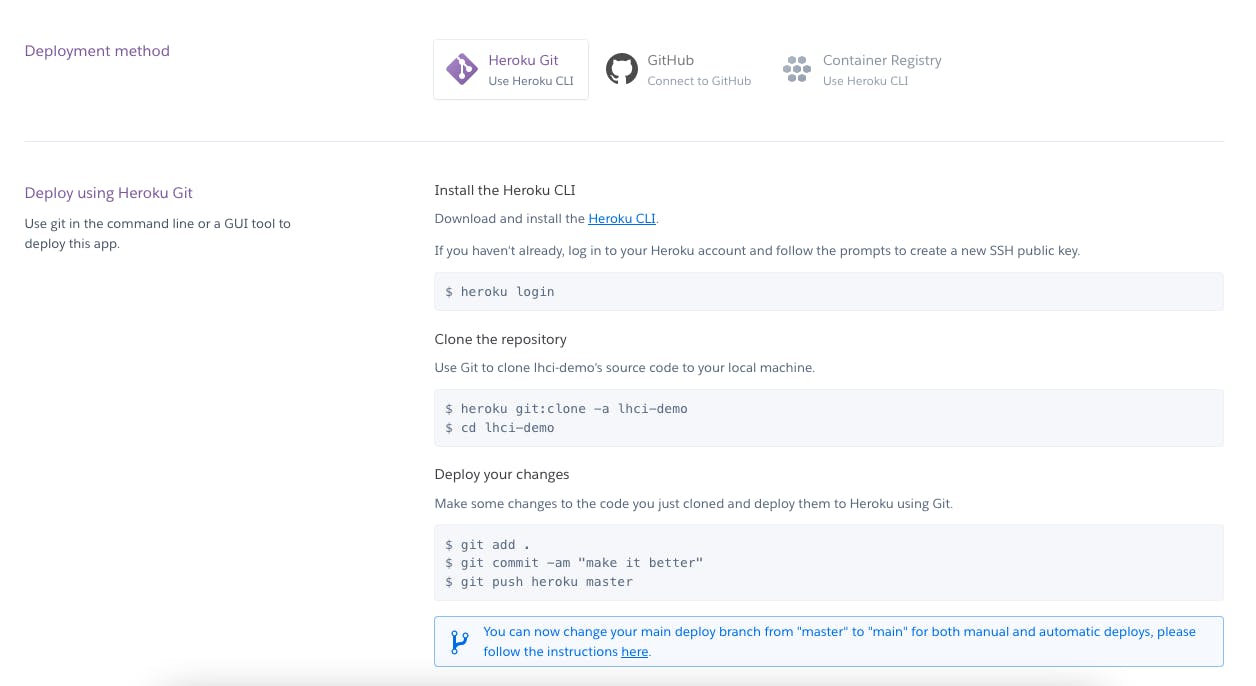
Now that you’ve pushed your code, Heroku will automatically deploy it.
The Flow
Now that you have everything you need, let’s see how the whole thing works.
You start by pushing some code changes by raising a PR. That PR triggers the Lighthouse CI workflow. The Workflow now runs the tests and uploads the reports to the dashboard.
Once it’s done, you can view the dashboard and see your results.
You can compare different pages on the same build, and you can choose a base build for comparison. The UI is easy to use and allows you to slowly see the information you need, instead of displaying it all at once.

Conclusion
Lighthouse CI is a super useful tool that can be enhanced further with their Lighthouse Server. A very lightweight project allows you to set up the server easily within minutes. Heroku is a great starting point for people who want to try this out. With a little bit of setup, teams can greatly benefit from automated testing and reports that can be viewed through a UI, making it easy to chart progress and uncover action items.

